How to Read Crypto Charts: Candlesticks Explained for Beginners
DeFi Protocols & RWA On-Chain AnalystDeFi Protocols & RWA On-Chain Analyst · June 7, 2026 · 9 min read
Published June 7, 2026 · Reviewed to our editorial standards. This article is informational and not financial advice.
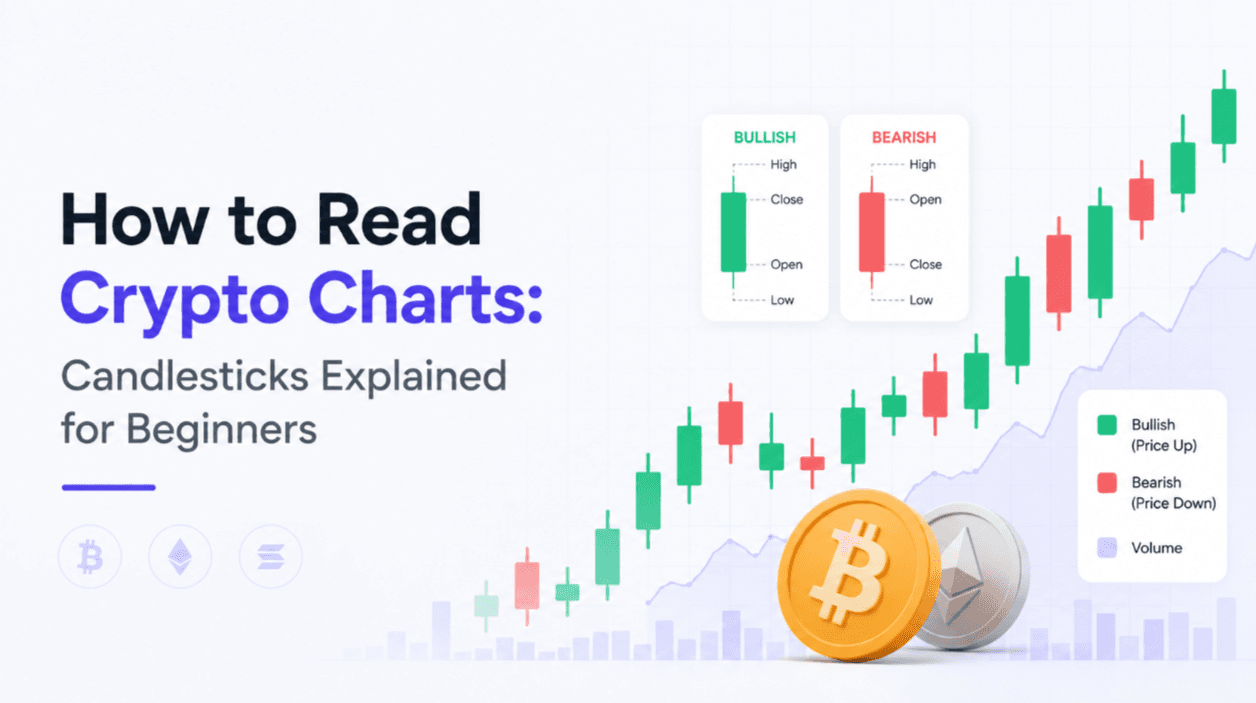
A candlestick chart shows four prices for each time period: the open, the high, the low and the close. The rectangular “body” marks the distance between open and close, while the thin “wicks” above and below mark the highest and lowest prices reached. Reading these shapes in sequence tells you who controlled price during each period and how strongly.
Key takeaways
- Each candle encodes open, high, low and close for a fixed time period.
- A green (or hollow) body means the close was higher than the open; red (or filled) means lower.
- Long wicks signal rejection — price reached a level and was pushed back.
- Timeframe changes meaning: a daily candle and a one-minute candle tell very different stories.
- Volume and context matter more than any single candle in isolation.
Anatomy of a single candle
Every candle has two parts. The body is the filled rectangle between the opening and closing price. The wicks, sometimes called shadows, are the thin lines extending from the body to the period’s high and low. On most crypto exchanges a green body means price closed above where it opened, and a red body means it closed below.
The relative size of these parts carries information. A tall body with short wicks shows decisive, one-directional movement. A small body with long wicks shows a fight: price travelled far in both directions but finished close to where it started. Learning to read that balance is the core skill.
What the wicks are telling you
A long upper wick means buyers pushed price high but sellers forced it back down before the close — a sign of rejection at that level. A long lower wick is the mirror image: sellers drove price down but buyers reclaimed ground. Repeated rejection around the same price often marks a level that traders are watching.
Why timeframe changes everything
The same market can look bullish on a weekly chart and bearish on an hourly one. A timeframe is simply how much time each candle represents. Higher timeframes (daily, weekly) filter out noise and show the broader trend; lower timeframes (5-minute, 1-hour) show short-term swings that can reverse quickly.
- Higher timeframes carry more weight because more participants act on them.
- Lower timeframes produce more signals, but most are noise.
- Many traders read the trend on a high timeframe before zooming in.
A candle is not a prediction. It is a record of a negotiation that already happened. — CryptoCoinBeat analysis
Common candlestick patterns
Patterns are recurring shapes that traders associate with shifts in momentum. They are tendencies, not guarantees, and they carry more meaning at significant price levels or after an extended move. A handful are worth knowing.
Doji
A doji has almost no body — open and close are nearly equal. It signals indecision. After a strong trend, a doji can hint that momentum is fading, but on its own it confirms nothing.
Hammer and shooting star
A hammer has a small body and a long lower wick, suggesting buyers absorbed selling pressure. A shooting star is its inverse, with a long upper wick after a rise. Both gain credibility only when the next candle confirms the move.
Engulfing candles
A bullish engulfing candle’s body fully covers the previous red candle, showing a swing toward buyers. A bearish engulfing does the opposite. Engulfing patterns are more reliable on higher timeframes and alongside rising volume.
Adding volume and support levels
Volume shows how many units changed hands during a period. A breakout on heavy volume is more convincing than one on thin volume, because more participants backed the move. Pairing candles with horizontal support and resistance — prices where the market has reversed before — turns isolated shapes into a readable map.
Beginners often overload charts with indicators. Start with price, volume and a couple of horizontal levels. Add tools only once you can explain what each one measures and why you trust it.
Common mistakes to avoid
- Reading a single candle as a signal without surrounding context.
- Trading tiny timeframes while ignoring the larger trend.
- Forcing a pattern onto a chart because you want it to be there.
- Confusing a level being touched with a level being confirmed.
Practising responsibly
Chart reading improves with repetition. Many platforms offer paper-trading or replay modes where you can test what you see without committing money. Track your reasoning, not just your results, so you can tell skill apart from luck.
This article is educational and is not financial advice. Technical analysis describes probabilities, not certainties, and no chart pattern can tell you what price will do next. Crypto markets are volatile and your capital is at risk. Do your own research and consider speaking with a licensed professional before making any financial decision.
Frequently asked questions
What do the colors on a crypto candlestick mean?+
Color shows direction. A green or hollow candle closed higher than it opened, meaning buyers were in control that period. A red or filled candle closed lower, meaning sellers dominated. Color conventions can be customized on most platforms, but green-up and red-down is the common default.
Which timeframe should beginners use?+
Higher timeframes such as the daily or weekly chart are usually easier for beginners. They contain less noise and reflect the decisions of more participants, so trends are clearer. Short timeframes generate many signals, but most are misleading until you have built experience reading price.
Are candlestick patterns reliable?+
Patterns describe tendencies, not guarantees. Their reliability improves at meaningful price levels, after extended moves and when confirmed by the next candle and by volume. Treat any single pattern as one input among several rather than a standalone trading signal, because markets frequently invalidate textbook setups.
Do I need indicators to read charts?+
No. Price, volume and a few horizontal support and resistance levels are enough to read a chart well. Indicators are derived from price and can help confirm what you already see, but stacking many of them often adds confusion rather than clarity, especially early on.
Written by
Maria FernandezDeFi Protocols, Real-World Assets, On-Chain Analytics, Stablecoins, Spanish-Language Coverage
Maria Fernandez is an On-Chain Research Analyst at **CRYPTO·COINBEAT**, specializing in real-world asset (RWA) tokenization, decentralized finance, and stablecoin ecosystems. Originally from Mexico City and now based in Miami, Maria brings a unique Latin American perspective to blockchain research, combining deep technical analysis with insights into emerging digital asset markets across the Americas. Before joining **CRYPTO·COINBEAT**, Maria spent several years researching decentralized finance protocols, producing in-depth analysis on lending platforms, governance systems, and the growing adoption of tokenized real-world assets. Her early research into institutional RWA integration and decentralized collateral models helped explain one of the fastest-growing sectors within the blockchain industry. Maria's analytical approach combines on-chain transaction analysis, protocol revenue metrics, liquidity monitoring, and governance activity to evaluate the long-term health of DeFi ecosystems. She works extensively with blockchain analytics platforms, including Dune Analytics, Nansen, and Flipside Crypto, and has created numerous public dashboards that simplify complex blockchain data for investors and researchers alike. Her coverage of stablecoin market events and liquidity shifts has helped readers better understand risk during periods of heightened market volatility. She holds a B.Sc. in Industrial Engineering from ITAM (Instituto Tecnológico Autónomo de México) and a Graduate Certificate in FinTech from MIT Sloan. Passionate about blockchain education, Maria regularly contributes both English- and Spanish-language research, helping make advanced on-chain analysis more accessible to a global audience while supporting the continued growth of crypto adoption throughout Latin America.
Keep Reading
Crypto Volatility and Risk Management: A Practical Framework
Volatility is the price of admission to crypto. Managing it — rather than fearing it — is what separates survivors from casualties.
Maria Fernandez · April 25, 2026→
Dollar-Cost Averaging in Crypto: A Practical Guide
Buying fixed amounts on a fixed schedule removes the pressure of timing the market. Here is how DCA works in crypto.
David Turner · May 5, 2026→
Crypto Market Cycles: What Drives Bull and Bear Markets
Crypto moves in cycles of expansion and contraction. Understanding the forces behind them beats trying to time them.
Maria Fernandez · May 23, 2026→